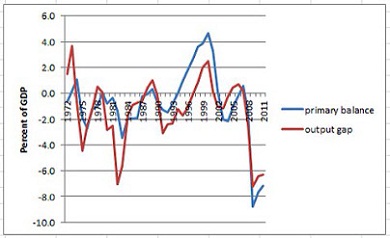
The primary deficit is the public sector’s minus interest payments and debt servicing. It is the most accurate figure to actually measure the effort made by a government to reduce that deficit.
The output gap is the difference between the real GDP and the GDP that could have been achieved with a minimum unemployment rate without adding to inflation. It is a rather theory concept than practical, but it is a useful analytic tool in spite of confusing estimates.
Economist Paul Krugman, and others, has demonstrated that the US government deficit isn’t as out of control as often portrayed. In the above chart, in fact, Krugman shows that the primary deficit per GDP is determined by the negative output gap per GDP, which basically tells us that political decisions have less to do with the deficit increase than the economic cycle itself. Krugman quotes one economists who believes the structural–the non-cyclical–deficit would be of 2 percent.
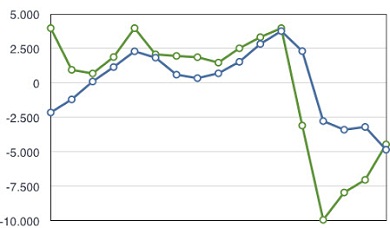
I have translated the exercise into Spanish, so to speak. In this chart, the blue line is the gap percentage per GDP and the green line marks the primary deficit per GDP, according to data from the International Monetary Fund on Spain. The time span goes from 1996 to 2012, that is from the Aznar government to Zapatero’s, to Rajoy’s.
Between 1996 and 2007, Spain enjoyed a primary surplus with strong growth and a gigantic bubble. The graph says that government plans were not behind the gains, but there was a sound GDP–higher than the potential outcome, with an over-EU average inflation.
Once the crisis settled down among us, the surpluses were revealed to be cyclical. The primary deficit dropped dramatically and faster than the output gap. Then, during the last three years there has been a harsh fiscal programme: the primary deficit has been cut even though the gap keeps contracting to -5 percent of current GDP.
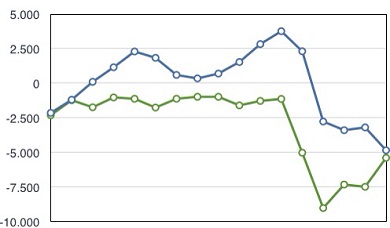
Applying the same data, here I show the evolution of the output gap but against the structural deficit–the deficit without cyclical fluctuations.
In times of plenty, up to 2007, the structural deficit approached 2 percent. In 2009, it fell to -9 percent of GDP. Now, it has somehow rebounded to -5 percent.
Following the US benchmark, once the structural deficit reaches 5 percent, equal to the output gap, it would be advisable to maintain the difference and let growth kick in, with real and potential GDP slashing distances.
Yet, the Spanish Constitution was altered in 2011 so the country was forced to comply with an structural deficit limit, that is, one of those Germany-inspired goals that far from being achievable only generates a vicious cycle of contradictions and contractions. Indeed, Spain’s deficit targets have been changed again and again to give it more time.
Deficit per GDP reduction in cold blood increases the debt per GDP ratio. We have been there, already. The sensible thing to do is to finance economic growth to shorten the deficit, even if it prolongs for a certain period the increase of debt.
The right thing to do for the European Union is to agree upon a U-turn: we must relax deficit targets, and we need the European Central Bank to impede monetary supply falls and to keep low interest rates until the economy recovers. Only then the eurozone would see actual green shoots.


Be the first to comment on "A definitive solution to the eurozone: follow the US tracks"