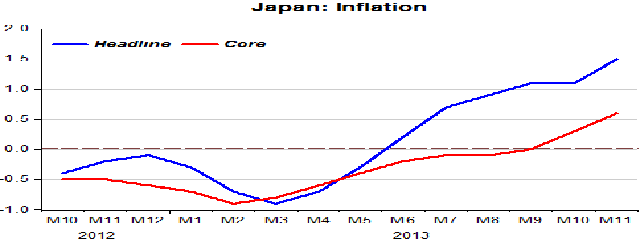
The first chart (above) shows the behavior of inflation, both headline and core. It appears to be gaining ‘positive traction’ after years of languishing in deflationary territory.
The next chart shows the bounce in aggregate demand (NGDP) and real output (RGDP).
The strong rise in the stock market is indicative of positive expectations about the effects of the plan. The depreciation of the yen is an important transmission mechanism of the expansionary monetary policy.
Read the whole article here.


Be the first to comment on "Abenomics one year on"