UBP | Several major Emerging Markets economies are gaining speed. Indian and Indonesian GDP have posted successive gains (second quarter GDP up 7.1% and 5.2% year-on-year respectively) and are likely to hold the current level of momentum given high government infrastructure spending. Russia is coming out of a recession; with the boost from interest rate cuts; GDP growth there could reach 0.5% this year and 1.0% in 2017. In Brazil, leading indicators are turning less negative and business confidence has improved significantly after the impeachment of Dilma Rousseff and her replacement as President by Michel Temer of the more market-friendly PMDB party. This, together with stronger exports, could limit this year’s recession to -2.7% setting up the economy for 1.0% GDP growth in 2017.
Overall, we expect EM GDP growth to bottom-out at 4.2% this year and to accelerate to 4.6% in 2017. This would be a turnaround from the decline in growth seen between 2010 and 2015.
Limited political risk ahead
With the exception of the upcoming US presidential elections, which is likely to be met with some market volatility in the event of a Trump victory, we see the EM electoral calendar as fairly light for the rest of 2016 and 2017. Political risks in some EM countries cannot be ignored though – ranging from the anti-US rhetoric of Philippines President Rodrigo Duterte to political infighting in the South African government – but their contagion impact on the overall EM fixed income and equity markets should be fairly muted.
The averted-coup in Turkey (15/16 July) and the government’s efforts to clean out conspirators and coup- supporters is likely to weigh on investment and economic growth in the country. Monetary and fiscal policy, as well as business-related regulations, should however remain orthodox, offsetting some of the growth fallout. GDP growth could be around 3.4% this year, compared to our previous expectation of 4%. Government institutions’ checks and balances have been weakened, which has weighed on the sovereign’s rating and prompted Moody’s to downgrade the country to sub investment grade (Ba1). Although volatility in Turkish markets is likely to be elevated, we do not think that it has the capacity to be contagious for the rest of EM.
The Turkish economic and financial sector’s interconnections to other emerging countries are modest. For example, China and Russia are Turkey’s largest EM trade partners and in 2015 their exports to the country were only 0.2% and 1.7% of their own GDP.
EM hard currency bonds: improving fundamentals and strong technical
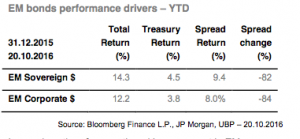
Dollar-denominated emerging market bonds have had a strong run year to date (YTD), driven both by the fall in US treasury yields (US 10-year yields have fallen by 53 basis points (bps) to 1.74% in the year to October 20th), and significant spread compression, as highlighted in the table below.
In our view, the aforementioned improvement in EM macroeconomic fundamentals supports the observed performance.
In addition, market technicals have also played an important role. Inflows into EM hard currency bond markets have reached over $42bn YTD, compared with outflows in the years 2013 and 2015, and a total of only $15.1bn for the full year of 2014. Local debt (+$12.3bn YTD) and EM equities (+$17.0bn YTD) have also regained investors’ favour, though to a lesser extent. In EM hard currency bonds, retail flows have clearly favoured EM sovereign bonds (notably through investments in ETFs), while EM corporate bonds attracted primarily institutional investors, which constitute a fairly stable and long-term investor base.
These increased flows have been met with higher issuance, especially for sovereigns ($106bn), where issuance is well above the trend of the previous five years. In contrast, supply in EM corporate bonds ($255bn) remains in line with previous years. A significant part of this issuance is used for debt management purposes (e.g. buybacks and maturity extension), which should help reduce issuers’ debt servicing vulnerability in the coming years. Asian corporate bonds continue to dominate supply, with over half of the new bonds issued so far this year. Issuance from the Middle East and Africa has picked up over the summer and is now above its levels for the same period in 2011-2015. In contrast, supply from Latin American and European corporate issuers has remained more limited, but has strengthened in the last few weeks. Importantly, issuance net of coupons and amortisations is expected to be close to zero, which again could provide additional support to EM corporate debt.
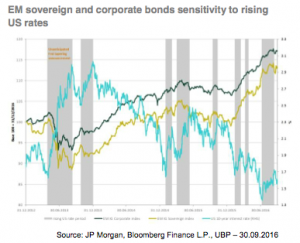
With developed market yields in very low to negative territory, emerging sovereign and corporate bonds are likely to continue to attract the attention of investors. We continue to favour EM corporate bonds, as the investment universe is far more diversified than EM sovereign bonds (in terms of number of issuers or sectors), which helps limit idiosyncratic risk. Additionally, EM corporate bonds benefit from lower interest rate duration, thus limiting their sensitivity to US interest rates. As a result, EM corporate bonds have shown greater resilience in periods of rising US rates than EM sovereign bonds thanks to their higher carry, higher spread cushion and lower duration.
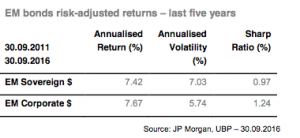
Both these factors of high diversification and low duration, have also helped limit the volatility of EM corporate bonds and contributed to the higher risk adjusted returns (Sharpe ratios) exhibited by this asset class over the last five years compared to EM sovereign debt.
While spreads have tightened significantly YTD, we believe that valuations still remain attractive. Looking ahead, we do not expect a repeat of this year’s double digit returns, but believe that spreads should be able to cushion any increase in US rates. EM investment grade corporate dollar denominated bonds appear best suited for investors with a lower risk appetite or tight credit constraints. Historical (12- month rolling) volatility has averaged only 2.7% over the last five years (4.15% over the last 10 years) vs 5.38% for EM IG sovereign (6.11% resp.) and 4.26% (5.04% resp.) for US IG corporate bonds.
For investors, with a higher risk appetite, investing across the full universe of EM corporate bonds appears the most attractive option as it offers the chance to take advantage of attractive opportunities across the whole credit spectrum. Given the improvement in fundamentals, we have gradually increased our allocation to high yield issuers over the year, from 36% to 47% as at the end of September.


