When the FOMC provided a vote of confidence in the US recovery by initiating its taper of its asset purchase program, the market effect was limited at the long end of the curve (which had already responded to the earlier signal that the taper was eventually coming) and the short end of the curve (where the 2y yield has been reasonably well anchored by a perception that the Fed is committed to postponing the first rate hike).
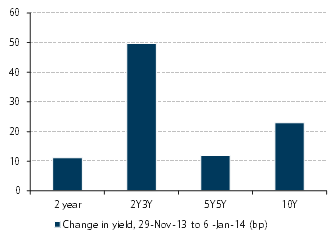
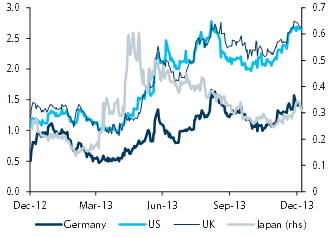
It was the belly of the curve, roughly corresponding to interest rates expected for 2016-18, that sold off most significantly (Figure 1). Market participants appear to have concluded from the FOMC’s December signal and strong data during the month that while interest rates would remain low for the next couple of years, the subsequent normalization would be more rapid than had previously been expected. The December sell-off in this portion of the curve was a global event, extending to UK, euro, and (uncharacteristically, for the normally insulated Japanese bond market) yen rates (Figure 2).
The combination of this perception that interest rate normalization may be more rapid than previously expected, with low and recently falling inflationary pressures, creates some interesting market risks. If, on the one hand, inflationary pressures remain very low, interest rates may be susceptible to downward pressure in the event (for example) that influential policymakers highlight the desirability of lower rates for longer in a non-inflationary environment.
On the other hand, despite the recent backup in rates, the yield curves in the main currency areas are still pricing a delayed and quite gradual recovery to historically more normal levels. For the past several years, interest rate and equity markets in the advanced economies have been preoccupied predominantly with economic activity. But financial markets seem likely to be increasingly influenced by shifting perceptions of the outlook for inflation, as well as activity.
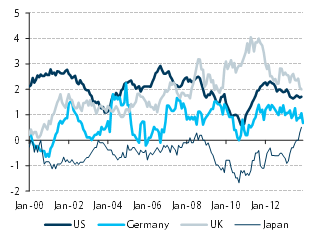
The subsidence of inflationary pressures is common to the US, UK, and euro area (where we focus on German inflation to abstract from idiosyncratic factors that have been driving (low) inflation in southern Europe). Weak commodity prices have been one driver, but measures of ‘core’ inflation that are designed to remove the direct effect of volatile commodity prices also show a substantial decline in the US, the UK and Germany and a steady rise in Japan (Figure 3).
The sell-off in rates coincided with falling core inflation (except in Japan), %

Note: 12-month inflation in the CPI excluding food and energy (for Japan, the ‘Western core’). For the UK, we show CPI excluding energy and unprocessed food. Source: Haver Analytics
Figure 3
The decline was to a substantial degree unexpected. At least in the US and Germany, where the cyclical context has (until recent months) been more solid than in the UK, the decrease in core inflationary pressures was predominantly driven by the price of goods (which are generally tradeable internationally), while inflation in the price of services (generally nontradeable and therefore driven by local rather than global factors) has remained more resilient. The UK experience is somewhat different, with a sharper decline in service price inflation, perhaps reflecting the weaker cyclical context.
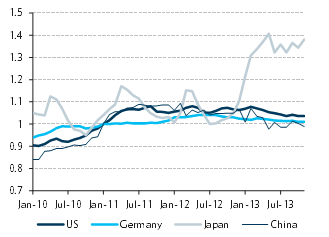
Receding inflationary pressures have been accompanied by downward pressure on globally traded goods in most of the world (unless measured in JPY), including in the US, Germany, China and (not shown in Figure 4) the UK, Korea, and other large exporters.
The international nature of the inflation surprise and the apparent contribution of internationally tradeable goods suggest a global explanation. The very large yen depreciation that began in late 2012 is the most plausible candidate, and it seems likely that it has played an important role, even if it is not the complete explanation. (That other factors are partly responsible is suggested by the fact that the deceleration of inflation generally pre-dates the yen shock by at least a few months.) The question is how this shock may play out over time.
The international spill-overs of monetary policy-induced exchange rate shocks are by their very nature temporary. The depreciation of a trading partner’s currency initially puts downward pressure on the home currency price of domestically produced goods that compete with the suddenly less expensive foreign goods, but over time the higher inflation created by the monetary expansion leads to a normalization of relative prices, during which time the downward pressure on domestically produced goods gradually fades.
Although it may take years for this process to be complete, in the current Japanese case, it is likely to be well underway in the 2016-18 period that concerned us above. In this sense, the market’s willingness to look through recent downward pressure on inflation when it contemplates the path of interest rates over this transition period seems reasonable.
That said, it seems plausible that Japan’s trading partners and competitors have not yet fully accommodated the very large yen depreciation, and downward pressure on prices may persist for some months to come. Therefore, despite the likelihood that the globally disinflationary consequences of the yen shock will fade within the next couple of years, they may nevertheless created a period of elevated downside risks for rates in the months immediately to come.
Weakness in the price of internationally traded goods intensified in 2013 (except in yen)


Be the first to comment on "Interest rate moves are out of sync with inflation, what next?"