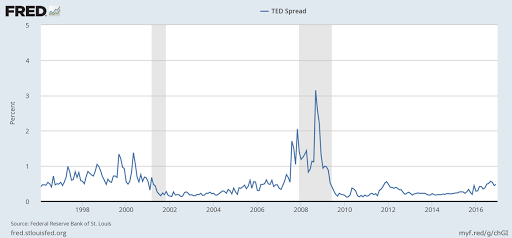
The TED spread is an indicator of liquidity tensions in the interbank market. It is the difference between the 3-month interest rate on interbank loans and the yield on 3-month US Treasury Bills. The T-bill does not entail any capital risk, so that any rise in the indicator would point to an increased risk in interbank operations, which would lead the banks to ask for more Treasuries and be more reticent about granting loans.
The TED spread was an indicator which was followed very closely during the 2008 crisis, when the collapse of the liquidity markets caused it to shoot up, as can be seen from the graphic, when it normally hovers below 1 percentage point.

The Fed’s last rate hike caused unease in the market, as can be seen in the next graphic. It’s still the TED spread, but over a more recent period of time.

It’s not that the figure of 0.7 percentage points is alarming, but it’s clear that there has been a certain amount of “commotion,” and at least some banks have had liquidity problems. The maximum tension point is in the past, which leads us to assume that it will return to normal. But not very quickly, judging by the amount of time it has shown signs of tension, exactly from when the Fed raised rates in December 2015. And that’s the interesting thing: a whole long year during which it has been showing signs of liquidity problems in the interbank market, related with the Fed’s specific rate hikes of a quarter point in each case.


