Does the recent upturn in inflation signal the end of a 40-year disinflation cycle?

inflation rises

Capital Group | In the two graphs published below you can see the evolution of inflation data in both the short and the long term.

In the second one, we see inflation and money supply indicators moving downwards (with some logic).

On the other hand, if we look longer term, our experts extend the inflation data back to 1955 and wonder whether the pick-up we saw in inflation in recent months is signalling the end of a disinflation cycle that started 40 years ago.

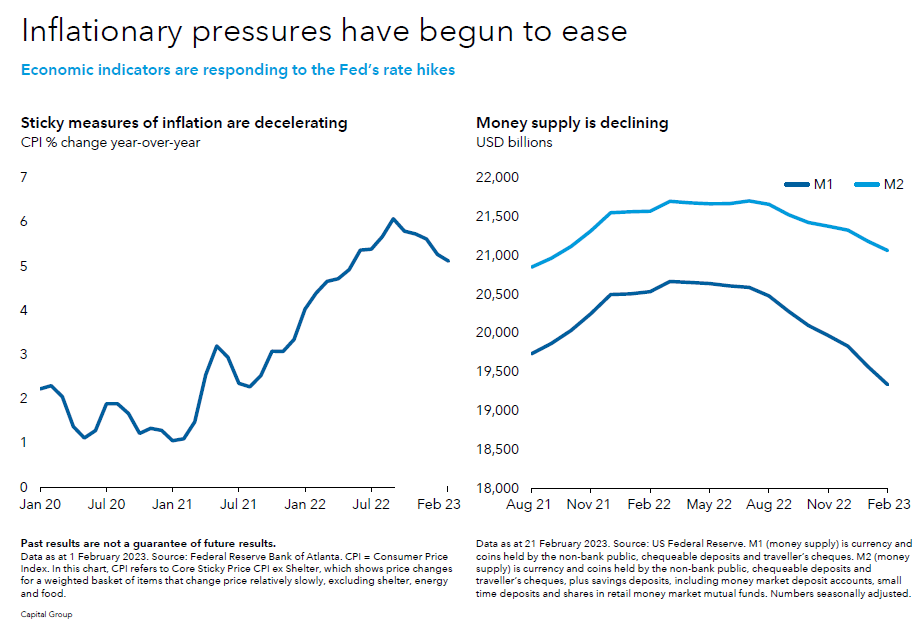
image001 2
image002 4

About the Author

The Corner
The Corner has a team of on-the-ground reporters in capital cities ranging from New York to Beijing. Their stories are edited by the teams at the Spanish magazine Consejeros (for members of companies’ boards of directors) and at the stock market news site Consenso Del Mercado (market consensus). They have worked in economics and communication for over 25 years.