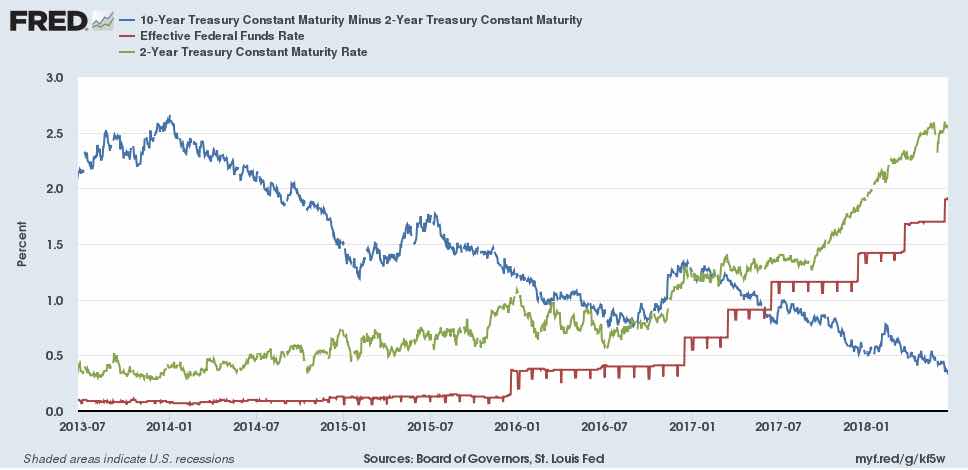
For some months we have been looking with concern at the spread of interest rates of US 10 minus 2 year bonds as an indicator of an ever closer recession. Indeed this indicator has been moving towards zero, and if it goes negative – which seems to be the trend – it would signal the threshold of a recession. But I don’t think it is such a precise indicator.
It is the blue line in the graph. As can be seen, it is ever lower and closer to zero. This is basically because the Fed is raising the base Federal Fund or interbank (FF, red line) rate, which attracts higher the two year rate (green light).
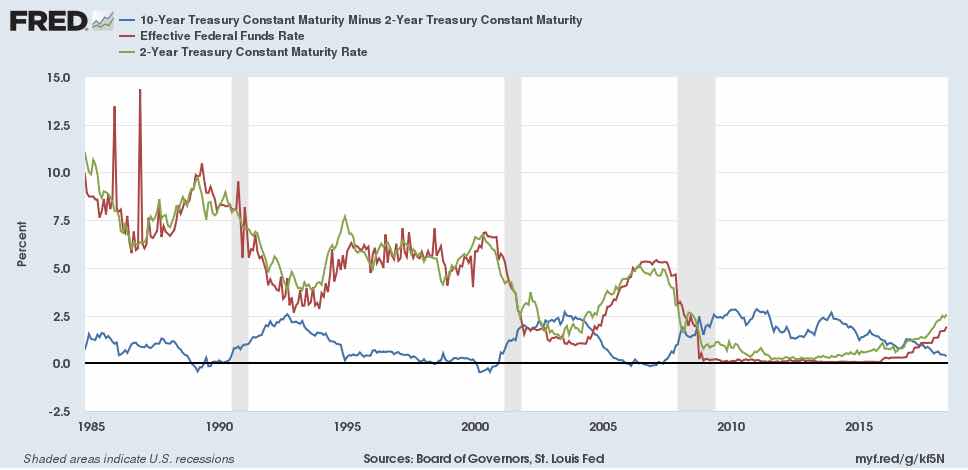
But is this really the best indicator? In the next graph we look at the past. We see something interesting. It is true that, just before each recession, the spread of 10 minus two years goes negative. But it appears that the relation of two years minus the FF, which inverts just before the recessions, putting itself above the FF. The grey areas are official US recessions.
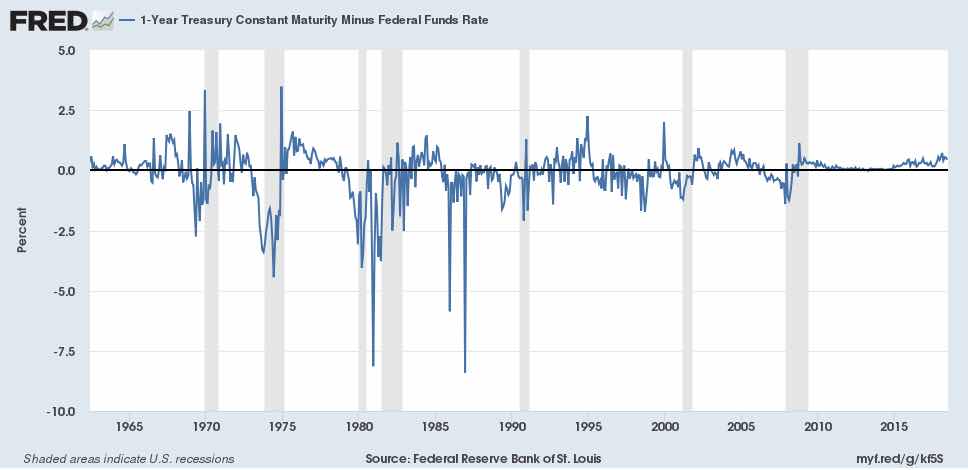
On the other hand, the two year interest rate at the moment remains solidly above the FF. Therefore perhaps we have a more accurate indicator of a change of cycle if we look at the spread interest rates of one yea minus the FF. This is well defined and shown in the next graph:
This really offers us a more precise alarm system for changes of cycle, as we see with all the recessions since 1970. It’s sensitivity to imminent change is impressive.
In in this case we can say that we are in a delicate position, but not close to the next recession.
This would confirm that it is the Fed that causes recessions, as Krugman has said many times. The Fed begins to raise interest rates when it sees the danger of an increase in inflationary expectations: what the central bank fears most is that these expectations consolidate. Once the rise begins, it is difficult to stop it at the optimal moment.
In 2007, Greenspan gave this situation of long term rates below Fed rates a name: “the Conundrum”. Why did market rates not follow the line marked by the Fed? Perhaps if he had taken this as serious warning from the market, precisely, that he was putting at risk the fragile balances of debts and the bubble, which was then about to burst, he would have stopped raising interest rates, given that the price of physical assets had begun to fall. Once the collapse had begun, the best was to stop pressuring the rest of the economy, which had enough to deal with as its assets became unsellable while debts and their servicing were threatening.
Today we are not in a very different situation, with a stock market bubble threatening. It would be better not to talk of “normalisation of rates” as if it existed, without reading clearly the signs and auguries of the capital.


