Marcus Nunes | The headline numbers for February: 242 thousand jobs and 4.9% unemployment rate. Let´s give these numbers some “structure”. The unemployment rate is the result of two forces that reflect economic decisions by individuals and firms. The first is the employment population ratio (EPOP). The second the labor force participation ratio (LFPR). The unemployment rate is equal to 1-(EPOP/LFPR).
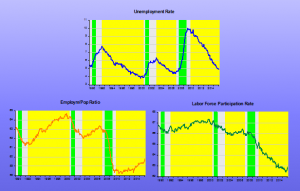
The charts show the behavior of unemployment together with its two determinants over the three most recent cycles. The first two (1990, 2001) happened during the “Great Moderation”, while the third (2007) takes place during the “Depressed Great Moderation”.
The green bars denote recessions (as determined by the NBER). The yellow bars denote periods of falling unemployment.
A “healthy” fall in unemployment occurs simultaneously alongside a “strong” rise in EPOP and a “moderate” rise or stable LFPR.
In the present cycle, the fall in unemployment reflects a stable and then “moderate” rise in EPOP and a falling LFPR. It´s another “animal” altogether!
Many say that this reflects mostly structural/demographic changes, like baby-boomers’ retirement. The coincidence in time of the structural/demographic factors with the onset of the “Great Recession” that witnessed the largest drop in nominal spending (NGDP) since 1937 is “too much to swallow”. More likely strong cyclical factors were responsible for bringing forward in time decisions that otherwise would have taken place over the next several years. In this sense the problem is mostly “cyclical”.
Although the economy is still adding jobs at a rate that could be called “healthy”, the relatively low quit rate (which tends to rise when employment opportunities are “bountiful”), the relatively high duration measures of unemployment (indication that opportunities are not “bountiful”) and the relatively weak (if you take into consideration the depth of the employment drop) job growth, indicate that the labor market is some distance away from having fully recovered. In other words, like the economy, it´s still weak!
More evidence on the “special” nature of the present (2007-) cycle.
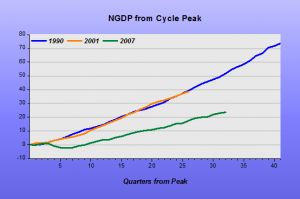
We start with the chart for NGDP (peak to peak over the cycles).
The 1990 and 2001 cycles are, except for length, identical. The present cycle suffers from lack of spending.
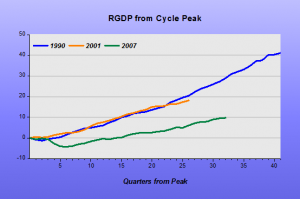
That´s mirrored in the behavior of RGDP.
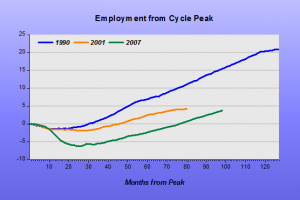
Now, when you look at the behavior of employment, the 2001 cycle shows a “surprising” result. From the behavior of NGDP and RGDP one would expect it to also mirror what happened in the 1990 cycle.
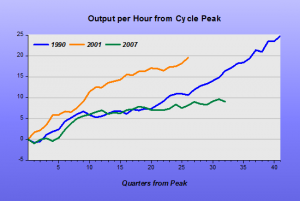
But when you look at the behavior of productivity, the employment difference becomes understandable. The 2001 cycle was “productivity rich”.
The present cycle, on the other hand is both “employment poor” and “productivity poor”. In addition, it is also “price & wage poor”
Maybe it´s not farfetched to associate much of the overall “poorness” of the present cycle to the sorry state of nominal spending, i.e. aggregate demand!

