(The following are excerpts from a BNP report)
History rarely repeats in identical fashion and there are clear differences in the political backdrop in Europe, the economy in Europe, and the structure of the equity market in Europe. In particular it would not be appropriate to argue that the political support for economic revival is as convincing in the euro-area today as it appeared to be in Japan during H1 2013. Caveats aside, it can still be helpful to benchmark the current price action in Europe with the Japanese example.
Conventional wisdom is that the initial strength in the Japanese market saw all the exporters and overseas earners outperform. The reality is not quite so clear.
The Japanese overseas earners did have an initial relative pop, but this leadership did not persist and domestics traded every bit as well. In Europe the preference for overseas earners has gone on further than we saw in Japan. In our view, such export orientation now becomes vulnerable given less directional clarity in the euro.
As a reminder, the political and policy timelines that underpinned the Japanese ‘QE trade’ can be summarised as follows:
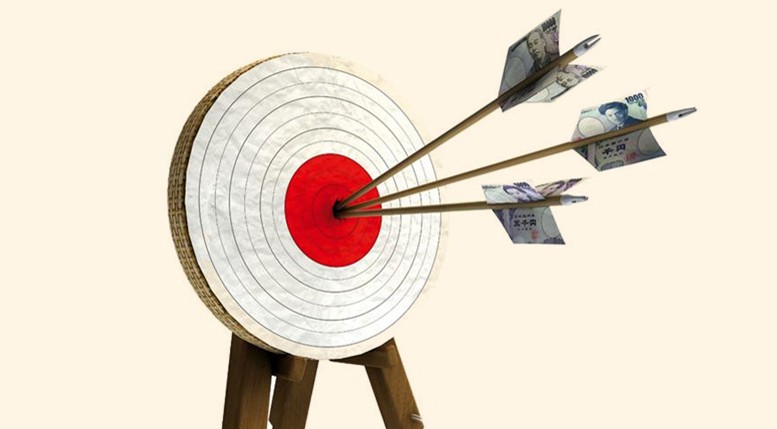
– December 2012; Shinzo Abe wins Japan’s General Election with a mandate to pursue his ‘Abenomics’ agenda. The three arrows of economic policy are laid out as fiscal stimulus, monetary easing and structural reforms.
– Jan / Feb 2013; Abe announces a 10 trillion Yen fiscal stimulus and nominates Kuroda to head the central bank.
– 4th April 2013; the Bank of Japan announces a major escalation in its QE programme, designed to double the monetary base and return inflation to 2%.
– Mid 2013; House of Councillors election gives Abe complete control over the Diet in theory smoothing the path to contentious structural reforms (although in reality the politics has remained difficult in this respect).
– 31st October 2014; the Bank of Japan announces an escalation in its asset purchase programme to 80 trillion Yen annually (an additional 10 – 20 trillion Yen).
Against what was considered a ‘shock and awe’ policy combination, financial markets responded aggressively. A large part of the price adjustment came through in the ‘anticipation’ phase, with the majority of the action actually done by the time the Bank of Japan announced its monetary easing programme in April 2013.
– Between mid December 2012 and the Bank of Japan’s QE announcement on 4th April 2013, the Nikkei 225 rose around 40%.
– Between mid December 2012 and 4th April 2013, the Yen fell almost 15% against the USD.
– The equity rally continued for around a month after the April Bank of Japan announcement. The Nikkei rose another 20%. The Yen weakened another 10%.
– Over the next 12-months, from the peak in May 2013 – May 2014, markets did very little. The Nikkei actually fell around 10%, and the Yen strengthened around 2%.
– The Nikkei and Yen did not return to decisive upward and downward trends respectively until the autumn of 2013 when expectations of further BoJ easing started to build.


Be the first to comment on "Euro QE trade – benchmarking against Japan"