UBS | As attention turns towards fiscal stimulus as a means to drive global growth, infrastructure investment is considered a politically feasible way to justify government spending. Despite increased focus, however, deploying additional meaningful funds for infrastructure spending is never easy. The US infrastructure, for instance, has received intermittent attention over the last several years, trying address an aging asset base (e.g., 2015 FAST Act), but these efforts have not been a game changer. However, if the new US administration is able to push its plan forward, it might trigger an example that could be followed by other nations for years to come.
How big could US infrastructure spending be? We consider some scenarios
The current US capital deployment framework may make smaller scale programs more likely to be executed than larger scale ones. Because of the large base, our analysis suggests spending programs need to be big to have a widespread positive impact on the companies within our coverage. In aggregate, US infrastructure investment runs at ~$265b on a T12M basis ($164b gov’t sources) and in order to assess this trade-off, our scenario analysis consider s current and future federal and state programs. We frame our analysis against four critical questions: (1) project purpose ( why ), (2) area of investment ( what ), (3) funding mechanism ( how ), and (4) key beneficiaries ( who ).
Our scenarios are anchored by unique evidence
We partnered with UBS Evidence Lab to map potential US infrastructure projects. For instance, we analyzed the current status of 723k bridges in the US, and narrowed 133k which are obsolete and would need $106b to fully repair. We found that potential bridge projects with high traffic volumes are closer to the coasts, but the greater need (number wise) could be in mid-country. After analyzing scenarios for all programs, our base case is $20b/y in incremental spending (12% step up in year 1), driving 3% growth in the OEM equipment market and 2% growth in the rental market. The upside scenario (less likely), includes Trump’s $1t program spread across 10 year, or $100b/y.
A range of exposures within Machinery, Materials, and E&C
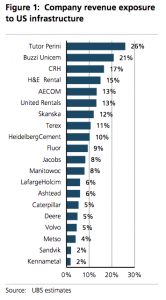
Company exposures, ranging from 2%-25% of sales are detailed in Figure 1. E&C’s have the highest exposure, at around 14%, with cement and rental companies averaging 11- 13%, and machinery closer to 5%. CAT, Deere and United Rentals have the biggest revenue opportunity due to projects near their dealer locations.


