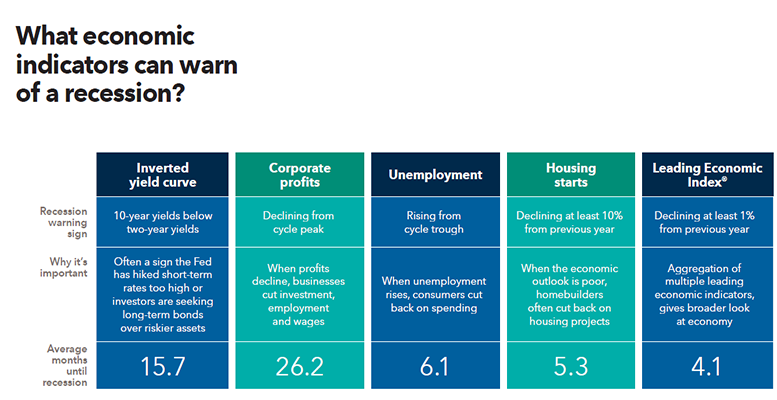
It is impossible to predict a recession with precision, even less when the scenarios are constantly changing and with variables still unknown. But indicators exist that let us calibrate where the risks are accumulating.
The economists from Capital Group Darrell Spence and Jared Franz indicate 5 points applicable to the US economy:
1) Inverted Yield Curve
An inverted yield curve is one of the most precise and extensive indicators of e recession. The curve inverts when sort term interest rates are greater than long term interest rates. This signal has preceded very recession in the US in the last fifty years. Short term interest rates tend to rise when the is tightening monetary policy. Long term interest rates can fall when demand for bonds is high. An inverted yield curve is a downward sign, given that it indicates that many investors are moving towards the safe refuge they see in long terms state bonds rather than buying higher risk assets.
In December 2018, the yield curve on 2 and 5 years US treasury bonds inverted for the first time since 2007. Other parts of the curve, like the returns on two and ten year bonds, two of the most common bonds, have not inverted yet. However, even an inverted yield curve in this range is not a cause of immediate panic, as normally there has always been a significant delay (on average 16 months) before the beginning of a recession. There is a debate over whether the interventions by central banks in bond markets has distorted yield curves to the point that is now a less reliable economic indicator, but this remains to be seen.
2) Company profits
To the extent that profits increase, companies can increase investment, contract more workers and improve wages. This benefits both companies and consumers of the economy and favours longer expansionary periods. Profits as a percentage of GDP usually reach their maximum towards the middle of the economic cycle and begin to slow long before the start of a recession.
Company profits remain at historically high levels, but there are reasons for thinking that they have already reached their high point. It is likely that incomes will suffer greater pressure from wage increases and inflation, the decline in the benefits from fiscal reform and an increase in the cost of inputs thanks to global trade uncertainty. If in 2012 there was a peak in company profits as a percentage of GDP, in the US the period between the peak and the beginning of the next recession has already exceeded 26 months.
3) Unemployment
Companies tend to cut jobs when profits decline because labour is often their main cost. As unemployment increases, consumers tend to reduce discretional spending to save money until employment perspectives improve. This behaviour damages the profitability of cyclical businesses, which could force to cut even further their work force.
The current US unemployment rate is close to historic lows and has been falling constantly throughout the expansion. The growth in wages has been below average compared to previous periods of expansion, but has begun to recover recently and could affect company profits. The US labour market has exceeded the level that many economists consider as “full employment” and has done so for years, and so there could be little margin for unemployment to continue falling. Employment is such a powerful motor for economic growth that even a modest increase in unemployment could be a clear sign of inflection in the economic cycle.
4) Beginning of housing construction
Housing represents a significant proportion of US GDP and can provide an important view of the health of the economy as a while. A robust housing market can help fuel the economy by providing property taxes for government spending, creating employment in construction and increasing the wealth of home owners. Housing construction is an important indicator because construction projects can last several months, and the constructors are reluctant to launch new projects is they fear the economy will collapse later.
A 10% decline in housing construction has preceded the majority of recessions, and a fall of 25% is not unusual close to the beginning of a contraction. From November 2018, housing construction has remained practically without change compared to the previous year and has accelerated slowly in recent months. Higher mortgage rates have generated a head wind, but this could change if the Federal Reserve slows the rhythm of interest rate rises in 2019.
5) The Leading Economic Index ®
Given that no economic indicator should be looked at alone, many economists and market forecasters have created their own score card aggregating their favourite indicators for measuring the health of the economy. The Leading Economic Index (LEI) of the Conference Board is a US economic indicator whose object is to forecast future economic activity. The index reflects 10 factors which include wages, unemployment claims, factory orders, share prices, housing permits and consumer expectation. In September 2018, the LEI had increased 7% compared with the year before, its most rapid increase in 8 years. Since then it has slowed a bit, rising 4.3% in December. The LEI has been a notably consistent in warning about recessions, but it does not offer much waiting time once it begins to decline. In the last seven economic cycles, a fall of at least 1% in the LEI compared to the year before preceded the beginning of a recession by an average of 4 months.


