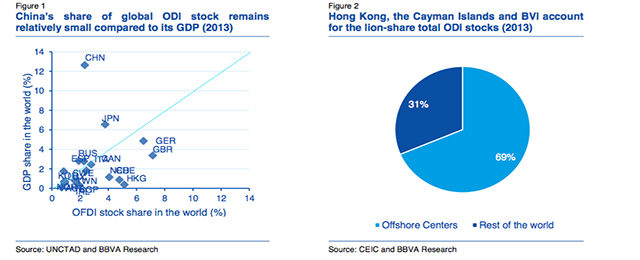
According to the Ministry of Commerce of the People’s Republic of China (MOFCOM), China’s outbound foreign direct investment (ODI) may have exceeded inbound foreign direct investment (FDI) for the first time in 2014. According to these figures, China’s FDI increased by 1.7% y/y, reaching USD 119.6 billion in 2014, while non- financial ODI increased by almost 11.0% y/y, reaching USD 102.9 billion. Assuming that ODI growth rates to the financial sector remain constant, this would place total ODI flows for 2014 at over USD 120 billion, surpassing FDI by a notch.
This result is remarkable because it implies that China may have already become a net exporter of FDI, something surprising given the country’s stage of development as well as relatively low share of global ODI stocks. In fact China may be far from being a net exporter of FDI. The reason for this is that ODI figures may be substantially distorted due to the presence offshore intermediaries such as Hong Kong and tax havens in the Caribbean, which accounted for circa 70% of China’s total ODI flows and stocks in 2013.
MOFCOM requires companies to register the first (not the final) destination of their cross-border transactions and do not take into account reverse flows, making it hard to determine the final size and distribution of Chinese ODI.
How much ODI goes where? Our estimates show that China’s ODI flows and stocks may have been overestimated and may be more diversified that previously thought. First of all, ODI flows and stocks in 2013 may have been much lower than reported by MOFCOM. The reason for this discrepancy is that approximately 40% of all flows to Hong Kong ending up reinvested into China as inbound FDI to benefit from preferential conditions (Xiao, 2004). In addition, the geographical distribution of Chinese ODI stocks and flows may be more balanced than previously thought, with developed markets in North America and Europe accounting for a larger share of final flows and stocks.
While Asia remains the largest recipient of Chinese ODI, its share falls from 70% to 50% according to our estimates. The fact that Asia is the major recipient of Chinese ODI makes sense given the region’s geographical proximity and close trade links with China. However, Chinese official statistics define Asia in very broad terms– which include the Middle East and Central Asia –so this figure would decrease significantly based on narrower geographical classifications.
Europe emerges as the second largest recipient according to our estimates. The continent goes from being a relatively modest recipient of ODI (8% of stocks and 6% of flows in 2013), to accounting for 19% of total stocks, and 17% of total flows in 2013. Take the European Union (EU) as an example: recent media reports have claimed that we are witnessing wave of Chinese investments into the EU; however official statistics place this figure at a modest USD 4.4 billion in 2013.
Our estimates show that Chinese ODI flows into the EU could have been closer to USD 10.4 billion in reality, challenging previously held assumptions that China remains a minor investor in the EU


Be the first to comment on "Chinese ODI: Where does it all go ?"