AXA IM | International trade volume is not expanding as fast as before the Global Financial Crisis (GFC). The average annual growth rate in international rate volumes almost halved to 2.4% in 2009-2015 from 5.1% in 2001-2008. For the first time in over four decades, international trade is growing less than world real GDP (the latter recorded at 4.2% in 2001-2008 and 3.3% in 2009-2015).
Recent research by the International Monetary Fund (IMF) argues that the slowdown in international trade growth is mostly attributed to structural factors and is therefore here to stay. According to the IMF, the slowing pace of international vertical specialisation is the culprit rather than increasing trade protection or changing composition of trade and aggregate demand.
Emerging markets with a share of 43% in world imports, witnessed the annual growth in their international trade volumes more than halve to 3.8% in 2009-2015 from 10% in 2001-2008.
Lower income elasticities of trade
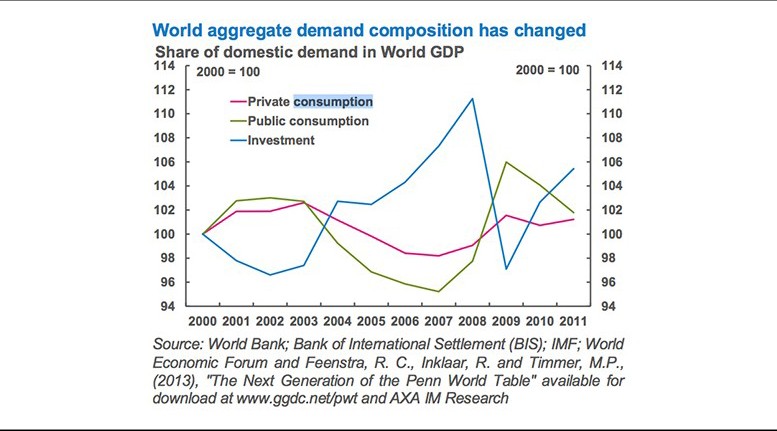
This lower trade elasticity, capturing the sensitivity of trade to changes in income, was most pronounced in Emerging Asia and Europe. This structural change in emerging markets’ trade elasticity is due to the aggregate demand composition which has changed towards less import- intensive components like public consumption. The share of investment in the world aggregate demand dropped significantly immediately after the GFC. Investment recovered somewhat subsequently, but not to its pre-GFC level. The share of private consumption was roughly stable. Importantly, the share of the least import- intensive aggregate demand component, public consumption, increased significantly and it exceeds that of private consumption in the post-GFC period. Hence, the change in the aggregate demand decomposition towards less import-intensive components partially explains the fall in trade, as investment recovered somewhat post-GFC.
Aggregate demand changed
The aggregate demand composition changed for EMs, too. The GDP share of investment increased across EMs, but in CEE it remained unchanged—partially justifying why CEE’s trade elasticity fell over time. Asia experienced the smallest increase in the investment share of GDP contribution.
Private consumption increased across the board; though in Asia it declined by 1.5pp between 2003-2007 and 2008-2011. This fall in the share of private consumption is further evident in the increase in the gross saving rate in Asia by 3pp of GDP to 43% of GDP between 2003- 2007 and 2008-2011.
Another explanation proposed for the slowdown in EM trade elasticity relates to the change in the trade structure. For example, a high share of services implies a lower trade international trade volume as services need less imported inputs to be produced relative to manufactured goods which have a larger imported component. Also, a change in the trade structure would have changed the relative importance of the trade elasticity of each component in the overall trade structure. The share of services in imports remained nearly unchanged across time and EM regions, except in MENA where it declined.
Chinese economic reform implies a lower, more sustainable economic growth profile, and a consequent lower global external demand from China, particularly for intermediate goods and commodities.
Impact of exports on GDP
Structural changes in international trade imply subdued annual growth going forward. In our books, international trade is not expected to accelerate by more than 2.3% to 2.7% year-on-year in 2016-2020. Weaker international trade growth would imply weaker economic growth for exporters.
A 1% decrease in exports shaves 0.6pp off EMs’ annual real GDP growth, on average. Unsurprisingly, it is mostly EM commodity exporters that will experience weaker economic growth due to weaker trade growth. EM manufacturers will fare better.
It is important to stress that few EMs have done their homework to reform, differentiate their product offering and support international competitiveness during the most recent expansionary phase of their business cycle. Commodity exporters are the laggards in that regard, contrary to their EM manufacturer peers. In order to generate 1% real GDP growth, EMs now have to invest more than they did in the past. Although the EM response to the OECD’s proposed reforms improved in 2014 relative to 2012, the measures introduced are still at the halfway stage.


