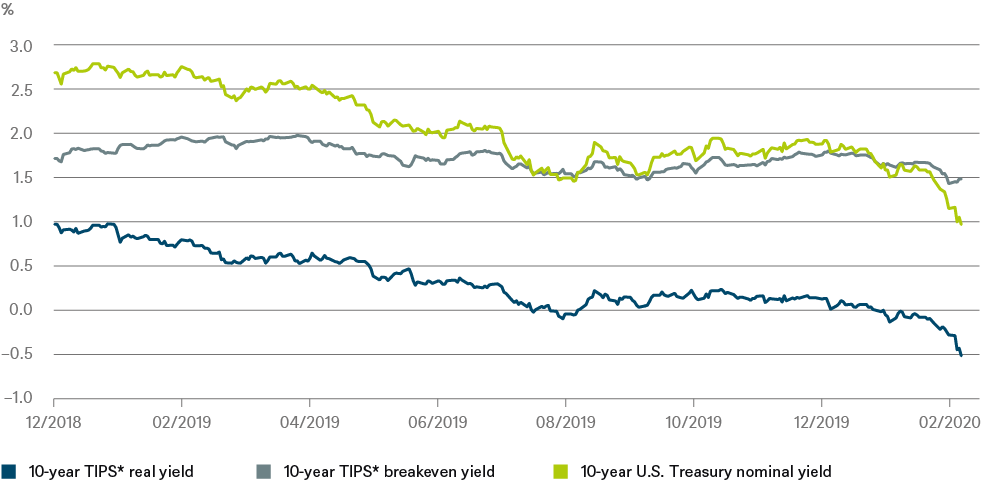
The U.S. Federal Reserve (Fed) unexpectedly cut interest rates by 50 basis points to a new target range of 1.00% to 1.25% on Tuesday, March 3. But U.S. yields have been falling for some time already, as DWS’ “Chart of the Week” shows. The considerable decline in U.S. Treasury yields last year was mainly due to dwindling real yields. In fact, as much as 130 of the 160 basis points of the nominal yield decline since the beginning of 2019 are accounted for by the real component. With a real interest rate of -0.5%, the United States has now also moved into the negative interest-rate territory that has long prevailed in many other industrialized countries.
Inflation expectations, as expressed in the breakeven inflation rate, do not generally coincide perfectly with consumer price inflation, as they are usually slightly lower. Nevertheless, the chart shows how stable inflation expectations have remained overall before, since the beginning of this year, moving substantially away from the Fed’s inflation target of 2%.
But the decline in real interest rates is even more remarkable. Many books can be written about the consequences of negative real interest rates. The signal for the capital markets, and especially stock markets, is ambiguous. Negative real rates might signal meagre growth prospects and an abundance of investment money, i.e. a savings glut. Optimists see the potential benefit from lower capital costs and the increased attractiveness of risk assets such as stocks and corporate bonds. Pessimists, on the other hand, see negative rates as pointing to likely structural weakness in growth. “The volatile reaction of the U.S. stock market to the Fed’s interest-rate cut shows investors’ ambivalence,” says Christian Scherrmann, U.S. economist at DWS. “The joy at lower interest rates may have been clouded by fears that the Fed sees greater risks to economic growth than the markets do.


