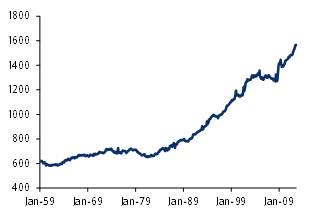
By comparison, Canada, which has a similar mix of denominations and presumably a similar taste for using paper money, has outstanding per capita currency demand of less than half the US level. Moreover, real per capita US currency has expanded threefold since 1959 (Figure 1).
Source: US Treasury, BLS, Barclays Research
The growth in the demand for paper money in an age of electronic currencies such as the bitcoin and electronic payments such as credit and debit cards would seem like a curious anomaly were it not for the Fed’s role in supplying it all.
The Fed passively meets the demand for currency – supplying and shipping the amount required by banks to support commercial transactions. Since the demand for currency has risen, this has meant the Fed’s balance sheet has steadily expanded. And until QE, it also meant that the Fed’s single largest liability was outstanding currency. Bank reserves, its other liability, were a tiny fraction of its liabilities.
But as the Fed’s asset purchases have swelled its balance sheet, bank reserves now dwarf currency outstanding by a factor of 2.05:1. When Fed officials discuss “normalizing” the Fed’s balance sheet – particularly in the context of selling (or not) assets – they are referring to shrinking it and, importantly, restoring it to a near pre-crisis ratio between bank reserves and currency.
By letting assets roll off without replacement the level of bank reserves will decline based on the maturity schedule of the underlying holdings. The pace at which bank reserves decline and the point at which the reserve-currency ratio is restored depends on the speed of security maturities as well as what happens to the demand for currency.
As a result, there are two unknowns in this balancing act: how quickly will people pay or refinance their mortgages (and thus, how quickly will the Fed’s MBS holdings roll off) and how fast does currency demand grow.
There is an additional unknown – what is the optimal level of bank reserves in an environment where banks are less penalized for holding them (via IOER) and given regulatory requirements like the LCR. We assume this optimal level will be between $250bn and $400bn – but no one really knows.
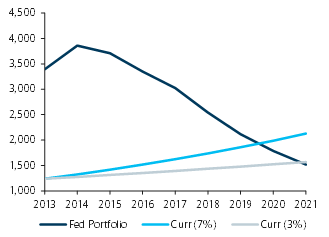
If we assume the Fed’s MBS holdings roll off at a rate of 8% per year and the Fed targets an optimal reserve balance of $400bn, currency growth of 7% points to balance sheet normalization in 2020 (Figure 2). But if currency slows to 3%, normalization would take place in 2022.

Figure 2 Fed balance sheet equilibrium ($bn)
Note: We assume the Fed wants to keep $350bn in reserves in the system. Dates are end-of-period. Source: Federal Reserve and Barclays Research
Our sense is that currency demand will turn out to be closer to the 3% level than the current pace as the pre-cautionary demand fades. However, we remain puzzled why electronic payments and other forms of transferring value have not already slowed currency demand – even allowing for the strong global appetite for $100 bills.


Be the first to comment on "US Currency, the Fed’s Other Liability"