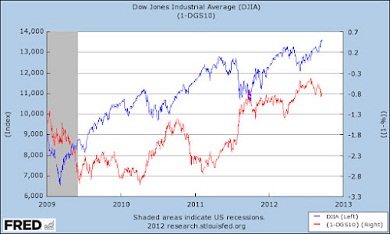
The blue line would be the Dow Jones index and the red would represent prices of the US 10-year bond, so here is a chart with equity and fixed income data.
Usually, these lines move in opposite directions because the stock market bears a higher degree of risk whereas those investing in sovereign debt seek assured if mild results to their allocated capital. That is why stocks suffer when Treasury bonds become the first option and market participants flee risk.
It's only when economic expectations improve that interest in stocks recover.
In 2009, as you see, the Dow Jones fell to its lowest point while Treasury bond demand rose. Since then, the stock market has experienced some spikes following the Federal Reserve's operation of liquidity expansion. This is what has always happened after a recession, but with longer continuity. Now though, in spite of the considerable volume of the Fed's monetary measures, investors remain unwilling to approach risk and stocks with a braver attitude.
In fact, all rises and recovery trends have been interrupted precisely in the last quarter of 2010, 2011, and the same could occur this year. The cause of these disappointing mishaps is non other than the euro. Whenever investors feel hopeful, inspired by the Fed's support, risk appetite grows.
But it rapidly deflates when the euro mess exacerbates and the currency loses steam.
Some US economists appear unable to recognise this link, but the euro trouble significantly cuts short the Fed's capacity to reinvigorate the American economy. And, unfortunately for everybody, Europe is running towards a deep, painful recession.


