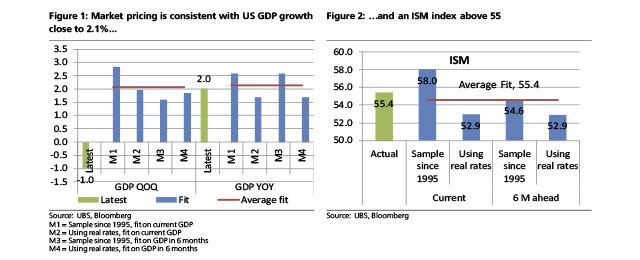
This conclusion, however, would not be consistent with the signals from other financial markets: the stock market should be suffering far more if the potential growth rate is indeed close to 1%. So in this piece we try to infer back – from a wide variety of asset prices – what the market is telling us about US activity levels in the near future.
We use the following financial indicators/metrics:
The stock market: The S&P in terms of level and change, both qoq and yoy. We also use a ratio of value/growth to see if a shift in style could provide useful information.
The curve: We use the 1Y, 2Y and the 10Y rates in both real and in nominal terms.
The FX market: The US dollar index, DXY, in terms of level and change, both qoq and yoy.
The credit market: We use both the investment-grade (IG) spread and the high-yield (HY) spread.
We want to know what these asset prices are telling us about economic growth –both current and also in the near future. We therefore try to explain both the US GDP qoq and yoy growth rates, and the ISM index. Because real rates are available only since 2004, we run two models: one using real rates, with data starting in 2004; and one without real rates, using data going back to 1995.
The result, in term of GDP forecasting, is very consistent across the board.Whatever approach we use, we obtain a forecast for GDP growth close to 2%.
This suggests to us that the direct reading of real rates in the long part of the Treasury curve is misleading. Taking into account a broader set of market datagives a more robust picture, albeit still not a bullish one. However, we take comfort particularly with the actual GDP data are more volatile than the outputs of our statistical model.
We obtain a similar result in the case of the ISM. Using several types of model, here too, leads to a decent growth signal, with the average ISM fit being slightly above 55.
Blame it on China
There may be a way of reconciling our findings with recent changes in the economy.Indeed, looking at the reaction of the curve to economic surprises, we find something very intriguing: lately the curve has been driven by EM data, not by DM data.
Let’s look at the numbers. First, we look at the correlation between the 10-year Treasury yield and our Economic Surprise Index; Over the sample we studied, on average the curve is more impacted by the DM surprise, which seems both logical and intuitive. But recently an odd pattern has emerged, with economic surprises in DM having a very marginal impact on the curve, while the impact of EM surprises has surged.
On the other hand, the short part of the curve, up to two years, seems to have a very low sensitivity to economic news, be it EM or DM. But for all the rates with a maturity above three years, we find that an economic surprise in EM moves rates by about 3bp, while an economic surprise in DM moves rates by less than 1bp.
In our note “Key Issue – Is the market wrong on inflation?” (27 May 2014), we tried to explain why Treasury yields have rallied this year. One explanation was China, and the above finding seems to support this thesis: the weak data in China and more broadly speaking in EM seems to have impacted the curve.
This does not fully solve the conundrum, though: if the Treasury curve is telling us a story about China, the stock market should also be impacted, and should have fallen. So we re-run our analysis of market reaction to economic surprises, this time for the S&P 500.
Interestingly, we find a similar picture: recent movements in the S&P have been influenced more by EM than by DM economic surprises. The big difference, though, is that this is a very recent trend: the impact of EM surprises has been high only over the past month, whereas the phenomenon started much earlier in the case of the Treasury curve. This might explain the divergence between the two markets: the negative surprises out of EM have been impacting the Treasury curve for much longer than they have been affecting the S&P.


Be the first to comment on "What the market is really telling about the US recovery"