AXA IM | Given the importance of trade in connecting the world economies, rising protectionist rhetoric in the US presidential election is particularly alarming. Both candidates, Hillary Clinton and Donald Trump, have made anti-trade and Free Trade Agreements (FTAs) remarks during their respective campaigns: Clinton indicated that she would renegotiate the North American Foreign Trade Agreement (NAFTA) and Trans-Pacific Partnership (TPP), while Trump was more radical, threatening to impose harsh tariffs on Mexican and Chinese imports, and pull the US out of all existing trade agreements, even the World Trade Organization (WTO)2. On investment, Trump also voiced tough words against US companies investing overseas, and threatened to punish them for costing jobs at home.
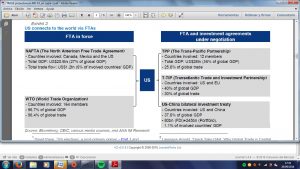
As an illustration of trade connections between the US and the rest of the world, Figure 1 summarises the major FTAs – signed and under negotiation – involving the US. It is worth highlighting that combining the under-negotiated trade and investment deals – TPP, Transatlantic Trade and Investment Partnership (TTIP) and US-China Investment Treaty – would allow the US to have trade access to the countries producing almost 90% of the world GDP. Terminating or delaying these negotiations, as Trump and Clinton both indicated, would therefore represent a significant set-back for globalization.
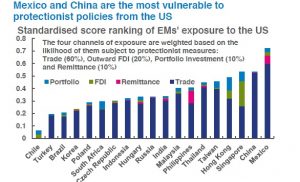
Worse still, if the US – as the world’s largest economy and trading nation – starts to impose punitive tariffs on all its import trade, then portfolio and international flows alike would be affected. Trade protectionism would most likely be accompanied by constraints in the free movement of capital in order to increase the efficiency of constraints on trade flows. Constraints in capital movement could curb the flow of remittances from immigrants in the US to their home country. We rank each country by the portfolio and FDI and remittance flows it receives from the US and the bilateral trade balance with the US. For each country, we calculate the z-score using the cross sectional mean and standard deviation; compute a weighted sum of the zscores with a subjective 60%-20%-10%-10% weight to Trade, FDI, portfolio investment and remittance respectively, and rank the country relative to its peers by the sum of z-scores. The higher the ranking, the higher the exposure of a country to the US via trade, portfolio, foreign direct investment and remittance flows.
As anticipated, Mexico and China top the league of most vulnerable countries because of the large trade surpluses they run against the US. Financial and trade centres, like Singapore and Hong Kong, are also highly exposed, because of investment ties with the US. Across the regions, Asia has the strongest link to the US, taking seven of the ten top spots. Since trade makes up for most of the exposure, it hints at the region’s vulnerability to any protectionist policies under the next US president.
Assessing impact of a protectionist US
In this section, we construct three scenarios of US trade policies and analyse their potential impact on EMs.
The worst case – a global trade war: a full implementation of trade-unfriendly policies from the US – including exiting all Free Trade Agreements (FTAs and imposing severe sanctions on all imports – could significantly disrupt the current order of world trade. Worse still, these protectionist actions will most likely be countered by immediate and fierce retaliations of its trading partners, resulting in a globalized trade war. We acknowledge, though, that this worst-case scenario is extreme, a thing of the past and unlikely to happen, given the established checks and balances in the US political system. For purely analytical purposes, we look at the global trade war of the 1930s as a benchmark. The “war” started by the US, following the passage of the Smoot-Hawley Act, which allowed the US to impose across-the-board tariffs on over 20,000 imported products. This was quickly followed by retaliations from 27 of the US’s major trading partners, and the situation quickly degenerated into a global tariff war. The result: a sharp contraction in global exports – 60% in value terms and 30% in volumes – between 1929 and 1932. Not all of this weakness was due to trade protections, of course, given the severe decline in global demand amidst the Great Depression which was well underway. However, if one compares the recovery in global manufacturing production and trade, the former had recouped all the losses by 1935, while the latter did not get back to the pre-1929 level until well into the 1940s. The much more protracted recovery in global trade was, in our view, a result of wide-spread protectionist barriers, which persisted until the 1940s.
Supplementing this analysis, we run a regression of the level of global trade volume (dependent variable) on the level of manufacturing output (independent variable) for the period up to 1929, and let the model “predict” (forecast) trade volume in 1930-1938. The distance between the actual and model-implied trade volume widened significantly after the 1929 crisis. Had global trade followed its usual relationship with manufacturing production, it would have recovered to its pre-crisis level by 1935. The accumulated gap between the model-implied and actual exports mounted to roughly 20% of model-implied exports by end-1938 . The discrepancy between the actual and the model-implied trade growth implies that factors other than the recession induced by the 1929 stock market crash were responsible for the protracted slowdown in global trade with the world trade war being among one of them. Overall, the anti-trade measures, originated in the US but quickly spread across the globe, did have a significant and standalone impact on global trade. These results are consistent with the mainstream views in the US (see Bernanke, 2013).
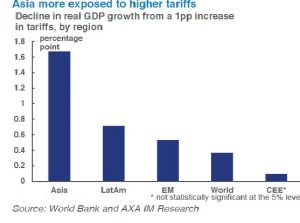
A repeat of the 1930s trade war would have a catastrophic impact on the global economy today. It is fair to assume that such a severe shock – e.g. a 20% decline in global trade6 – would be enough to arrest the fragile recovery and send the world economy into another recession. According to our past research, a 1% decline in exports results in a 0.6pp drop in EMs’ annual real GDP growth, on average 7 . Examining the direct impact of raising tariffs on real GDP growth reveals a similar impact to EMs’ real GDP growth implying that there is a one-to-one relationship between tariffs and exports 8 . Specifically, a 1% increase in tariffs is equivalent to a 1% decline in exports resulting into a 0.6pp drop in average EM real GDP growth. We see in Exhibit 7 that the sensitivity of real GDP growth to a hike in tariffs is more pronounced for Asia followed by Latin America, while it is not significant for Central Eastern Europe (CEE).
Very bad case – a regional trade war: instead of rejecting all FTAs and imposing across-the-board tariffs. Under this – less bad, but still very damaging – scenario, a trade war will break out among US, Mexico and China, with the US initiating protectionist measures, followed by in-kind retaliations by others. Different from the case above, the conflicts here will be confined within the two bilateral routes between the US and China/Mexico, and hence, the contagious effect should be more limited.
But for the countries involved, the impact will be severe nevertheless. While this will clearly inflict pains on the targeted countries (possibly leading to economic recession), the US will likely suffer badly as well. The US economy relies significantly on products from China and Mexico, which together account for roughly 30% of total US imports in 2015. Large tariffs on these products will raise imported inflation, potentially forcing the Fed to tighten faster and the USD to appreciate sharply. In addition, retaliations from China and Mexico will add insult to injury, as US exporters face retaliatory tariffs in their second and third largest markets. One estimate suggests that a full implementation of Trump’s tariff proposal of 45% and 35% tariffs on all Chinese and Mexican imports respectively would sink all three economies into recession simultaneously.
Good case – status quo: this is our base case scenario.
We expect the elected president to avoid a confrontational trade policy. There are plenty of past cases, whereby the presidential candidates tried to appeal to nationalist voters by making populist promises during elections, but acted oppositely once taking office. Both Bill Clinton and Barack Obama, for example, made protectionist remarks during their respective campaigns, but turned out to be strong FTA supporters as presidents, with the former signing the NAFTA and the latter initiating TPP and TTIP. After all, the bilateral trade deficit the US has with some EMs narrows once we account for the fact that the corresponding EM has to import intermediate goods from the US, in order to produce the exports it ships to the US. This is particularly the case for Mexico and China for which the bilateral trade balance with the US in value added terms, which accounts for the intermediate goods’ imports from the US, is lower than the bilateral trade balance in gross terms. This finding weakens the argument for trade protectionism in the US as the bilateral trade deficits once correctly measured, are not as wide as they appear originally under gross value added terms.
It is far from clear that trade protectionism in the US would be beneficial for the US economy too. Growth in export-supported jobs accounted for 40% of total job growth in the US in the 1993-2008 span, according to the International Trade Administration. The latter also argues that exports contribute an additional 18% to workers’ earnings on average in the U.S. manufacturing sector.


