
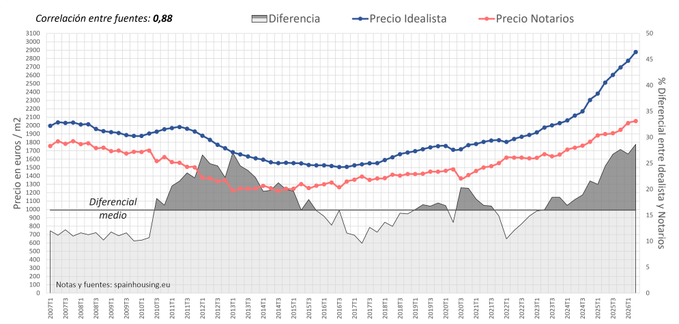
This difference serves as a solid indicator of the discount demanded in the market. Idealista.com, Spain’s largest property listing platform, projects the seller’s asking price—which is almost a wishlist—whereas notary records (notaries are always present at the closing of a deal) record the actual final price paid, which sits roughly 29% below the original listing price.
According to the chart compiled by spainhousing.eu:
- Left axis (line): Housing price in euros per square meter, based on Idealista.com and notary data.
- Right axis (area): Percentage difference (in absolute value) between the two sources.
Although both trends share similarities, prices reported by notaries consistently lag behind those listed on Idealista. This discrepancy likely stems from the fact that Idealista.com shows the seller’s initial asking price, whereas notary data reflects the real transaction price paid by buyers.
The spread and sharp changes serve to capture trend shifts:
- Spread: Represented by the gray area (right axis), it shows the percentage variation between the two prices. This difference can indicate the level of discounting taking place in the market.
- Sharp change: Represented by the green line, it illustrates fluctuations between the two prices. For instance, between 2010 and 2012, several downward movements occurred in succession, pointing to downward market pressure.


