BofAML | We have been among the most bearish on Euro Area inflation, expecting 0.9% post-Brexit inflation in 2017, versus consensus at 1.3%. This also applies to core inflation, where we expect a very mild trend over the next two years that would leave core inflation slightly above 1% by 2018. Still, markets are pricing declining inflation over the next few years.
A declining core?
Beyond the next two years this has to be driven by core inflation, since the impact of the more volatile components fades from that point. While we remain bearish core inflation, we fail to see the drivers of such a sizeable decline.
Is core inflation behaving like a random walk?
Core inflation has barely moved in the past three years. We are back to levels not too far from those seen when the ECB announced QE. Since the beginning of 2013 core inflation has averaged 0.9% with a standard deviation of only 0.2% (Chart 3). That is very stable and statistically it was clearly unexpected: with a declining output gap and a currency that has on average remained where it was at the beginning of the period, most models were probably predicting a mildly increasing core.
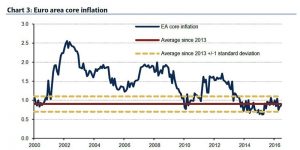
But, statistically speaking, the best forecast for core inflation in that period would have been ‘no change’. In other words, one cannot rule out that core inflation since 2013 has behaved like a random walk (i.e. the best predictor of tomorrow’s value is what we have today, there is no mean reversion). We have tested this. If you use the whole sample for core inflation, you can reject the traditional variance-ratio test. If you restrict the sample to the period from January 2013 to June 2016, the hypothesis that core inflation behaves like a random walk cannot be rejected with a 5% probability (although it can with 10%).
We are not saying core inflation is a random walk, as 42 observations are insufficient to draw meaningful conclusions. But it has certainly been behaving like one for quite some time. We think two important messages underline this:
- First, standard (macro) relations are being questioned, and it is not clear whether economist models that forecast inflation with the typical variables are going to be as useful as before. One could argue that changes in core inflation, as of today, are not predictable or, in other words, that the best forecast for core inflation tomorrow is the level of core inflation today. This gives even more relevance to our complementary analysis of the inflation outlook that looks beyond traditional models.
- We think this shows that there is no or very little traction when it comes to core inflation. Beyond the size of the output gap, which explains parts of this, this again brings the role of inflation expectations and the Phillips curve to the fore. In a world with perfectly anchored inflation expectations and a decent Philips curve one should be able to see much more action when it comes to core inflation.
Still low expectations
We have argued before that inflation expectations appear far from perfectly anchored at 2%, and that matters a lot for the dynamics of core inflation (see Dissecting the Phillips curve). This is particularly the case given the existing evidence of a flatter Philips Curve: the most important source of “pull” when it comes to inflation in the medium term would be inflation expectations.
We could spend hours discussing whether inflation expectations are properly measured, particularly market-based ones. 5Y5Y forward is not far from 1.30 – granted, there are some technicalities behind this, but it is still well below 2%. And as we have argued before, all measures of inflation expectations have limitations. Measures based on panels of forecasts have the drawback that forecasts are based on models that, in general, mechanically take inflation towards 2% as the output gap in the economy closes. Survey-based measures are typically short to medium term and hence tell us little about the far future. Market-based measures incorporate inflation risk premia and strong and time-varying liquidity distortions.
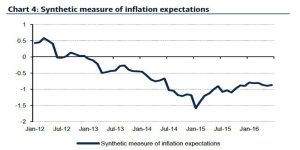
Our preferred approach has been to combine all existing measures. We think there is a commonality between them we can interpret as the theoretical measure of long-term inflation expectations. This is what drives our synthetic measure of inflation expectations.
We update in Chart 4 our work with the most recent data. We have shown before that the behaviour of this synthetic measure of inflation expectations goes beyond the impact of oil. The picture is still the same; our analysis shows that, at best, the risk of inflation expectations becoming permanently de-anchored is real and serious. The long downward trend in the last period of the sample shows the fragility of the anchoring of expectations, if not suggestive of a more worrisome pattern. This certainly weakens any traction when it comes to inflation dynamics in the medium run.
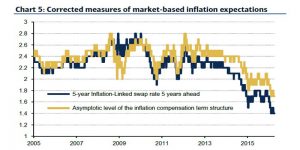
An alternative way of looking at inflation expectations would be to correct some of those technical issues with market-based measures. This is what Bank of Spain has done in its latest annual report (Chart 5). The picture is still the same – even corrected measures of market-based inflation expectations are far from being anchored.
The irrelevance of the Philips Curve
There has been much debate over what has happened to the Phillips Curve in the past few years since the Great Recession, both in the downturn and now that economies are recovering. The general consensus is that at the global level the curve is now flatter, i.e., the slope is now smaller and inflation is less sensitive to cyclical conditions. There is also some consensus that inflation is more sensitive to inflation expectations than it was before. A flatter Phillips Curve may actually work well on the way to 2%, given that we expect the output gap to remain negative throughout. And it also gives particular relevance to the role of inflation expectations on the way there.
But we would go one step further and argue that given existing conditions the shape of the Philips curve remains almost irrelevant over the next couple of years: irrespective of it, it will be very hard to get a significant move higher, let alone reach 2%.
To show this we update our “agnostic approach to the Philips Curve”. We generate 2,000 simulations of the Phillips Curve to see how many get close to 2% by the end of 2018. We randomly select (2,000 times) the two coefficients of the curve, the sensitivity to the output gap and the importance of inflation expectations. We then generate the inflation profile implied by each random draw, all the way to 4Q 2018. We use our estimates of the output gap and assume inflation expectations remain well anchored at 2%.
Chart 6 shows the results of this exercise. Of the 2,000 simulations, only 20% show inflation at or above 2%. In general, 2% is only reachable with much higher-than-usual sensitivity to inflation expectations. The pattern on the slope is less clear. Overall, the steeper the Phillips Curve, the higher the sensitivity needed to inflation expectations to reach 2%, in line with our discussion above.
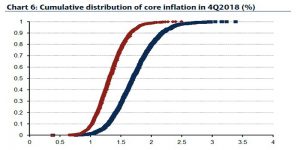
Additionally, this exercise is subject to the same critique we made at the beginning of this piece. 90% of the results are above current core inflation today given that we are assuming traditional models more or less work, even if we allow for a large variation in the shape of those relationships. This is driven by the fact that those random simulations are centred on “traditional” values of the relevant parameter. This means, in our view, that the results are potentially optimistically biased. Overall the message is that absent any shocks, irrespective of the shape of the Phillips Curve, it will be very hard for core inflation to creep much higher in the next two years.
And to emphasize the role of inflation expectations, we redo the previous exercise with inflation expectations at 1.5% instead of 2%. In this case only 2% of the results deliver inflation at or above 2%. We believe it will be very hard to bring (core) inflation back to 2% without a meaningful move higher in inflation expectations.
If not much higher, what about significantly lower?
We have argued above that core inflation will move only slightly higher going forward, and that recent dynamics could even call that into question (i.e. quasi random walk behaviour). Still, markets are pricing yoy headline inflation (excluding tobacco) well below current levels of core inflation all the way to 2020. Does that make sense? We do not think so unless there is a major shock that moves core in that direction.
Volatile components fade from inflation beyond the next couple of years (at least the current large distortions). Whatever happens, headline inflation is driven mostly by core inflation. Hence, to have headline inflation at levels of 0.6% we would need core inflation 30bps lower than it is today.
This is not what traditional models would tell you for core, given the closure of the output gap. This is not even what we argue, despite being very bearish inflation; recall that we see core inflation above 1% on average in 2018. Even if we were to accept that core inflation is a random walk, we would still find it hard to argue for core inflation at 0.6% at the end of 2018. A random walk with mean 0.9% and standard deviation of 0.2% would move within the 0.7%-1.1% range with a 95% probability (Chart 7).
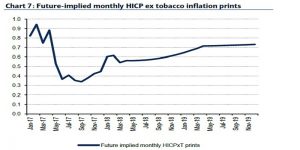
So what would we need to get inflation so low all the way to 2020? We would need either a constantly declining oil price or a significant appreciation of the currency in nominal effective terms. The markets/consensus expect neither of these at this point.
*Image: Flickr


