The Fair Observer | By Vaclav Smil
“Adding insult to injury” sounds like a lawyerly phrase compared to its painfully evocative Japanese equivalent nakitsura ni hachi – literally “a bee to a crying face”. But even that stinging proverb fails to convey what Japan has been through during the recent past.
In March 2011, its economy, slowly recovering from the worst global post-World War II downturn, was hit by a powerful earthquake followed by a massive tsunami. That twin disaster disrupted many supply chains of Japan’s important manufacturing sector and caused a catastrophic failure of the Fukushima nuclear power plant; the ensuing fears led to the eventual shut-down of all of the country’s nuclear generating stations, limited electricity supply, increased imports of fossil energies and the first annual foreign trade deficit in a generation.
But even without these setbacks the country’s record during the past two decades would stand in sharp contrast to its 35-year-long rise from post-World War II destruction (pre-war gross domestic product, or GDP, was equaled only in 1954) to the world’s second-largest economy whose accomplishments by the 1980s were widely seen as a foundation for further advances toward possible global leadership in the 21st century.
Japan’s economic face has not been smiling for more than two decades, since the early months of 1990 when the bursting of the real estate bubble and the falling stock market exposed the fragility of those seemingly solid pre-1990 achievements and ushered in decades of stagnation and uncertainty.

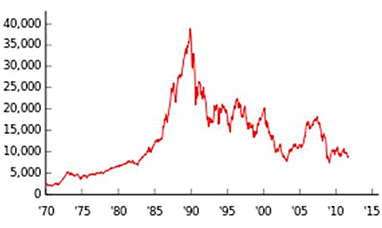
The Nikkei index, 1970-2012
Of course, no stock market is a satisfactory proxy for the state of a country’s economy and Japan’s GDP. Although heavily affected by speculative trends that were the undoing of the Nikkei and registering minimal gains and even absolute declines in some years as in 1998 and 1999 and, again, during the global economic downturn in 2008 and 2009 overall the economy registered growth over the decade.
Expressed in constant monies, GDP was 17% higher in 2000 than it was in 1990, and in 2010 it was 7.3% above the 2000 level (Econstats 2012). That is a sharp deceleration compared to a 50% gain during the 1980s and 56% gain during the 1970s, but no economy of that size could have continued to grow at rapid pre-1990 rates.

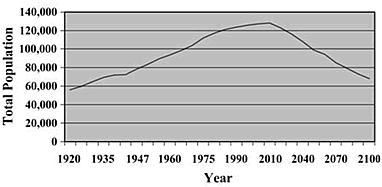
Population growth and projections
Origins, extent and consequences of these challenges have been described in numerous books, reports and papers that cover every aspect of this socio-politico-economic malaise ranging from aging, sordid party politics and dysfunctional governments to speculation, deflation, stagnation and rising inequality. A good sample of this literature might be seen by consulting (limiting the selection to English-language books) Wood (1992), Alexander (2002 and 2008), Nakamura (2004), Takatoshi and Mishkin (2004), Hamada and Kato (2007), Sato and Imai (2011) and Hamada, Kashyap and Weinstein (2011).
There seems to be little disagreement among the economists (Japanese or foreign) about the gravity and persistence of these challenges, and a closer look at some basic indicators shows the extent of the post-1989 retreat and readjustment.
In December 1989, the Nikkei index stood at 39,900. A year later it was at 20,800 (48% down) but there was widespread belief that it could, and would, come back. But by 2000 it was at 13,800 and the talk of a lost decade became a cliche. Another decade later the Nikkei ended at 10,000 and by May 2012 it slipped below 9,000, nearly 80% below its peak value: that is as if the Dow Jones index, with its peak at 14,164 in October 2007, would now be bumping just above 3,000 instead of dancing around 13,000.
The first consequences of the great economic readjustment that began with the fall of housing and stock market values more than two decades ago were excesses of corporate equipment, staff and debt, all resulting from large losses of market capitalization. Then – after a short period of renewed, albeit slower, growth following eight stimulus packages – the double dip (GDP declined in 1997 and 1998) led to collapse of several major banks and brokerages and the contraction in aggregate demand resulting in chronic deflation. Fiscal and monetary measures could not provide a rapid cure for massive balance-sheet recession, and long-term economic stagnation has been complicated by structural problems, primarily by aging, and soon also shrinking, population, growing income disparities and disappearing local economies.
Given the country’s very low population growth (from 123.6 million in 1990 to 128 million in 2010, a gain of just 3.6% in two decades, the average per capita GDP in 2010 was 21% higher than in 1990. In comparison, the average US per capita GDP was 31% higher in 2010 than it was in 1990 despite the fact that during the intervening two decades the country’s population grew by nearly 25%. The French gain was almost identical to the Japanese increase (per capita GDP about 22% higher in constant monies, but the country’s population was more than 11% higher in 2010 than in 1990) while Germany, despite the high cost of unification, managed a per capita rise almost as high as in the US (29%), while its population grew by just 3% in 20 years.
And Japan’s share of the global economic product also declined faster than that in Germany or the US: between 1991 and 2010 it fell by 37% (from 9.2% to 5.8%), compared to 31% in Germany and only 11.5% in the US (from 21.8 to 19.3%, with all values calculated adjusted for purchasing power parity).
Post-1990 years have also changed Japan’s often extolled low income inequality: during the late 1980s the average income of the top 10% was seven times that of the poorest 10%; by 2010 that gap was more than 10-fold, or roughly two-thirds higher than in Sweden, Europe’s leading paragon of income equality (OECD 2011; Sato and Imai 2011).
As a result, Japan is no longer the country with the least inequality among the major affluent economies: the latest international comparison (OECD 2012a) shows Japan’s Gini coefficient (0.329) still lower than in the UK (0.342) and the US (0.378) but higher than in Canada (0.324), Germany (0.295) and France (0.293). By the mid-2000s Japan’s poverty rate (share of the people with incomes below poverty line) reached 15% and among all OECD countries only the US, Turkey and Mexico were slightly higher (OECD 2010).
Moreover, Japan’s poverty gap (percentage by which the mean income of the poor falls below the poverty line) was also very high: at 35% it was similar to the US and Mexican rate while Canada and Sweden had gaps of only about 25%.
Even more remarkably, Japan is the only country in this group where absolute poverty increased and, moreover, only South Korea’s poor have lower income among the Organization for Economic Cooperation and Development economies than do the poor in Japan (Katz 2012).
And it gets even worse when looking at the elderly: for people above 65 years of age Gini coefficient is close to 0.4, and for those above 75 it is above 0.4 (Horie, Oshima and Tsukagoshi 2008). By 2010, 30% of all retirees and nearly half of all retirees living alone (mostly widows) were living below the poverty line – while the news about the disappearance of billions of dollars from pension funds, about underfinancing of those funds and about their mismanagement indicate more troubles ahead (Fukase 2012).
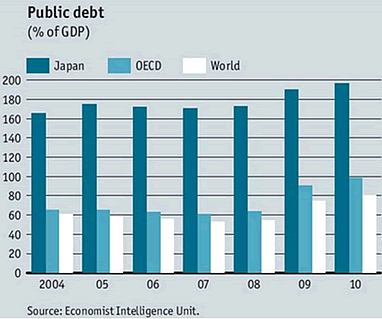
The recent global economic recessions has exposed unsustainable reliance on higher government debt in all major affluent economies, but Japan is in a category of its own.

By 2011, the country’s general government debt rose above 200% of annual GDP, compared to 130% in Greece and Italy. In terms of net financial liabilities, the 2012 government debt was about 52% of nominal GDP in Germany, 66% in France, 80% in the US – and 135% in Japan while Greece’s net liabilities were 145% of GDP and Italy’s 100% (OECD 2012b).
As a result, the rating of Japan’s debt was repeatedly downgraded over the last decade: Moody was first to lower it from the top Aaa to Aa1 in November 1998, S&P followed in February 2001; by the end of 2011 Moody’s rating was down to Aa3, S&P’s long-term rating was down to AA-, and in February 2012 the agency announced that it will consider another downgrade if Japan’s unsustainable spending trend is not reversed.
Viewed from another perspective, however, 93% of the government debt has been financed internally, most of it by deposits held by the country’s banks. In contrast, shares of general government debt held by non-residents have surpassed 50% for the US – with China now ranking first, followed by Japan and the UK (US Treasury 2012).
Similarly, more than 40% of Spain’s and Italy’s general government debt are held by foreigners and the shares are nearly 50% in Germany and almost 60% in France (Global Finance 2012).


Be the first to comment on "Special Japan: A Sinking Economy In The Land Of The Rising Sun"