UBS | We’ve marked to market for 4Q15 and lowered our 2016 Brent/WTI oil price forecasts ($/Bbl) to $42.50/$40.00 (from $57.50/$52.50), reflecting the much weaker 4Q outturn and lower entry point into 2016. In the near-term the market remains oversupplied and we expect global inventories to continue building until 3Q16, dampening any potential price recovery. In the medium term however we view current prices as unsustainable: we believe much of the recent fall is short – term momentum driven with limited reference to longer – term fundamentals, not unusual when the market is unbalanced given the gulf between cash costs of existing supply ($30 – 40/bbl) and the long-run marginal cost. However, like all capital cycles, this one continues to turn: 2016 will see the full impact of the collapse in the US rig count, driving a 0.8Mb/d contraction in non-OPEC supply.
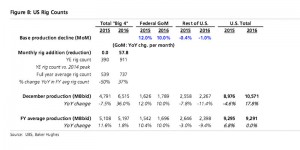
We estimate a minimum of 520 rigs would be needed in the “Big Four” oil shale plays and 720 oil rigs overall in order to hold U.S. oil production flat YoY in 2016. The required rig count would presumably decline over time as US E&Ps continue to improve efficiency rates (defined as production per rig) through quicker spud – to – spud times and improved reserves per well. This assumes over half of the US shale rigs would be in the Permian, which has the largest reserves/well and is experiencing the most material efficiency gains given it is in the earliest stages of the learning curve when compared to the other 3 big oil shales in the US. We should note that the US would also need to run 200 rigs on conventional assets to enable flat production, implying an oil rig count of 720 would be needed to hold US oil production flat. For perspective, this compares to the peak US oil rig count of 1,601 in the fall of 2014 and the 2015 average of 750 and the current rig count of 516.
Meanwhile, the market looks tighter from 2018 onwards as the impact of the dearth of project sanctions in 2015 is felt (1.3Mboe/d vs the norm of 5Mboe/d). As this becomes more apparent, we believe the focus will shift to the price needed to incentivise sufficient new investment to offset decline (5 – 8% per annum) a nd meet incremental demand (~1% per annum) – a figure of $70 – 80/bbl in our view which still implies a phenomenal reduction in unit costs from 2014 levels.
Lowering our US natural gas price forecasts
We’ve also lowered our 2016 – 19 & long – term, normalised na tural gas price forecasts ($/MMBtu) to $2.45, $2.75, $3.00, & $3.25, respectively, from $3.25, $3.75, $4.00, & $4.00. We now forecast 2016 suffering from the overhang of a material storage surplus, as well as a more tempered long – term demand growth outlook coupled with the ability to meet demand growth with prices well below $4/MMBtu.
…but not your typical mark – to – market note
Beyond the revised oil price forecast, the remainder of this report provides UBS’ answers to the most frequently as ked questions on oil prices and our market outlook. These span a wide range of topics including: the outlook for upstream capex and the response of non – OPEC supply to prices; the nature of OPEC’s role in the market; the shape of the global cost curve; dema nd elasticity; and natgas/LNG markets.


